Sayed Ally

Developer and Data Analysis Portfolio
Master of Commerce: Information Technology
Developer tools: React, Javascript
Data tools: SQL-Excel-Tableau
currently learning: Power BI
View My LinkedIn Profile
Send Email
Data Revenue Power BI Project
Project description: In this online course project, I have used datasets provided by codebasic to generate a dashboard that displays revenue information.


Overview
This project entailed creating a dashboard to meet the needs of a stakeholder that requested specific KPIs. The interview video basically spelled
out the different metrics that are require. A crucial aspect of the entire process, understanding what the client requires and which data can be used
to create the end result. In this instance, the hotel industry has specific ratios and KPIs that are required by management to create the desired dashboard.
The dashboard preview below depicts the various KPIs that have been put together in one place for the client.
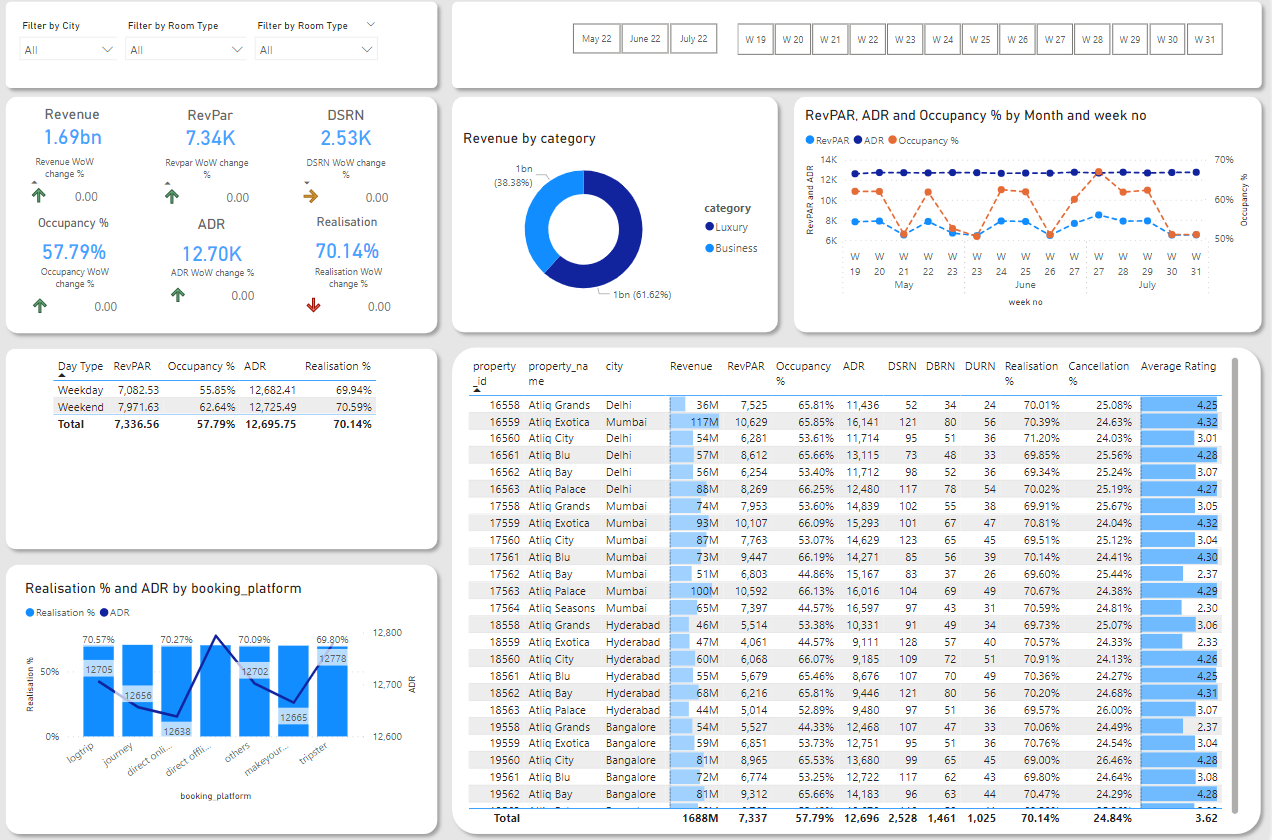
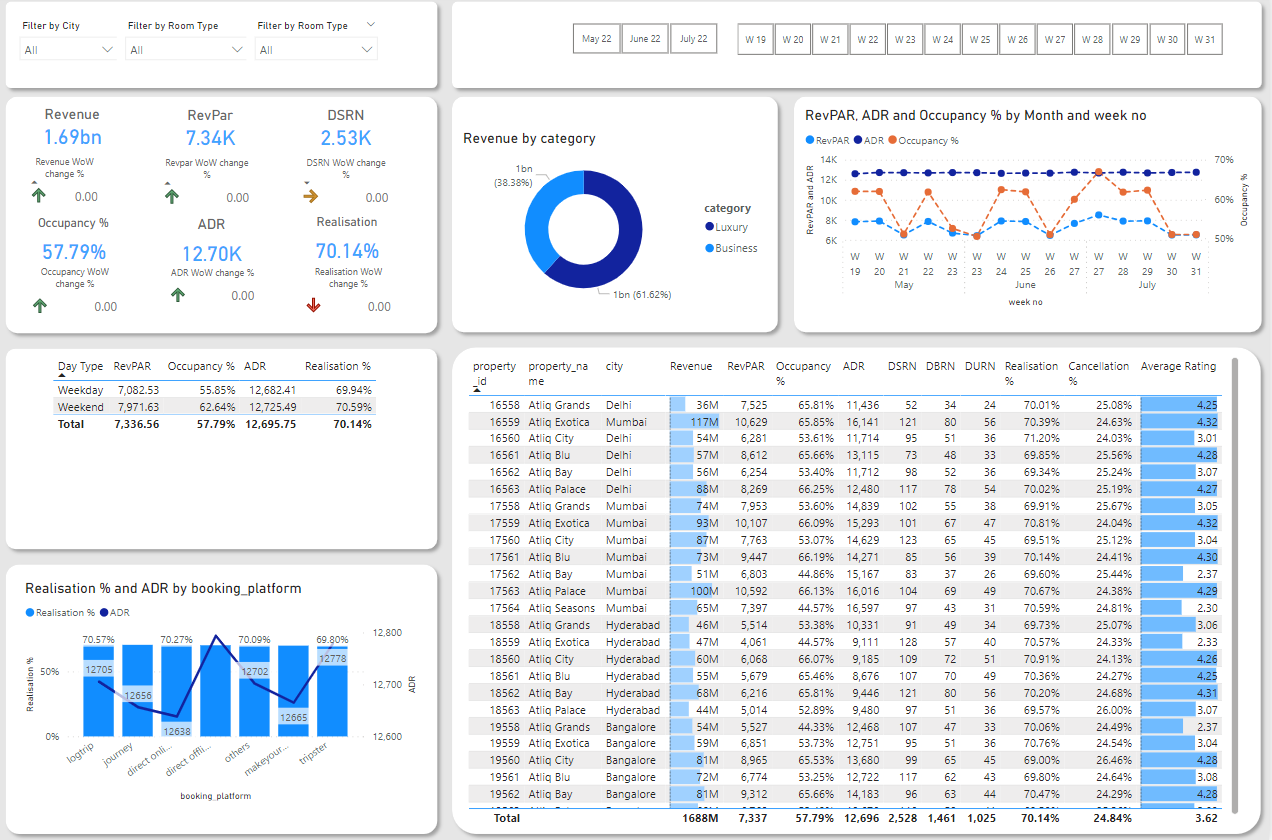
Some of the key aspects that I have taken away from this project are the following:
-Better insight into the hospitality business
-Loading data from multiple excel sheets, and ensuring table relations are correct.
-removing columns, setting headers. (via PowerQuery)
-Using PowerQuery to further assess and prepare data
-DAX to create measures - different formula use cases
-understanding business formulas and KPIs
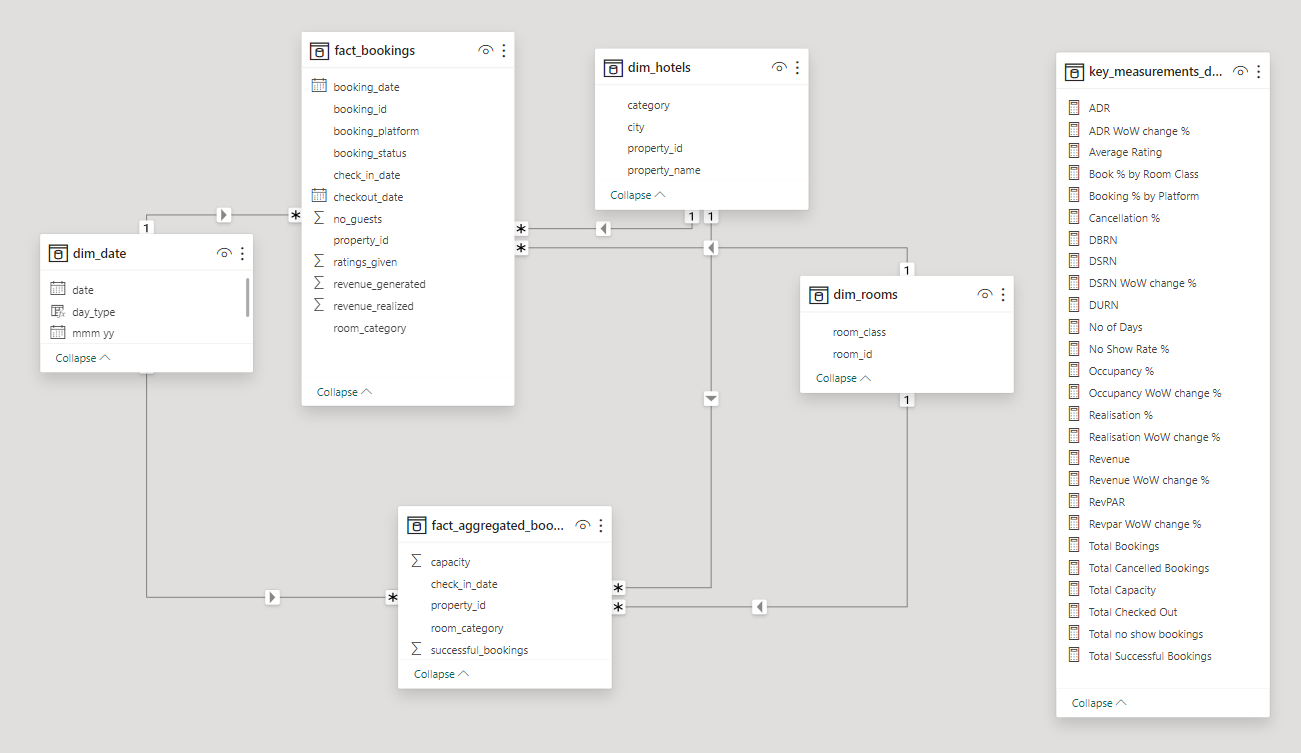
Managing relations
You will also observe the key measurements entity. In this case all the measures have been created here and are used to
create the different components of the dashboard.
 View Image
