Sayed Ally

Developer and Data Analysis Portfolio
Master of Commerce: Information Technology
Developer tools: React, Javascript
Data tools: SQL-Excel-Tableau
currently learning: Power BI
View My LinkedIn Profile
Send Email
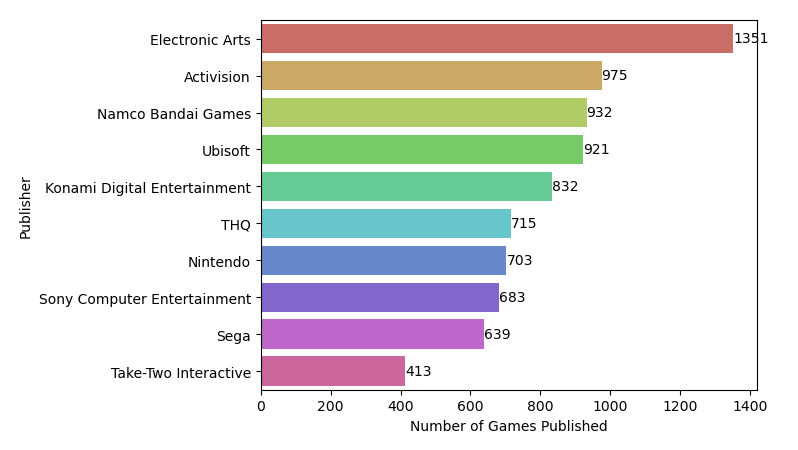
How Quality Video Games defy Quantity in the Global Market
Project description: This data visualization project is based on a Kaggle dataset. The data here-in provides an insight into the relationship between quantity of video games published vs quality of fewer games published
Overview
The original dataset provided was free from Kaggle and scraped from VGChartz. I used Python, specifically Pandas and Seaborn to perform the analysis. Please visit the link below to read the article.